by Chris Aragao
Years ago, I found political science papers that referenced “significant activity” (SigAct) data. SigActs can be thought of as a record of notable events that occurred while service members were deployed overseas. There are many categories of SigActs and also other data points tracked in these datasets, like who or what the target was.
I became very interested in this data because I saw this as a way to streamline benefits for Veterans. I did not know how to make this work, but I was lucky enough to collaborate and learn from others.
Once our team came up with the first version of a dashboard, we immediately were hit with a “So what?” response. The main critique of it was that it did not cover Vietnam.
If you don’t know me, I have a tendency to not say anything when I am challenged like this. I tend to use these challenges as motivation, and I make every effort to prove people wrong. The following year, we published the Vietnam Visual Order of Battle.
Little did I know that this would set me on a path of learning data analytics and that it would ultimately lead to a career change.
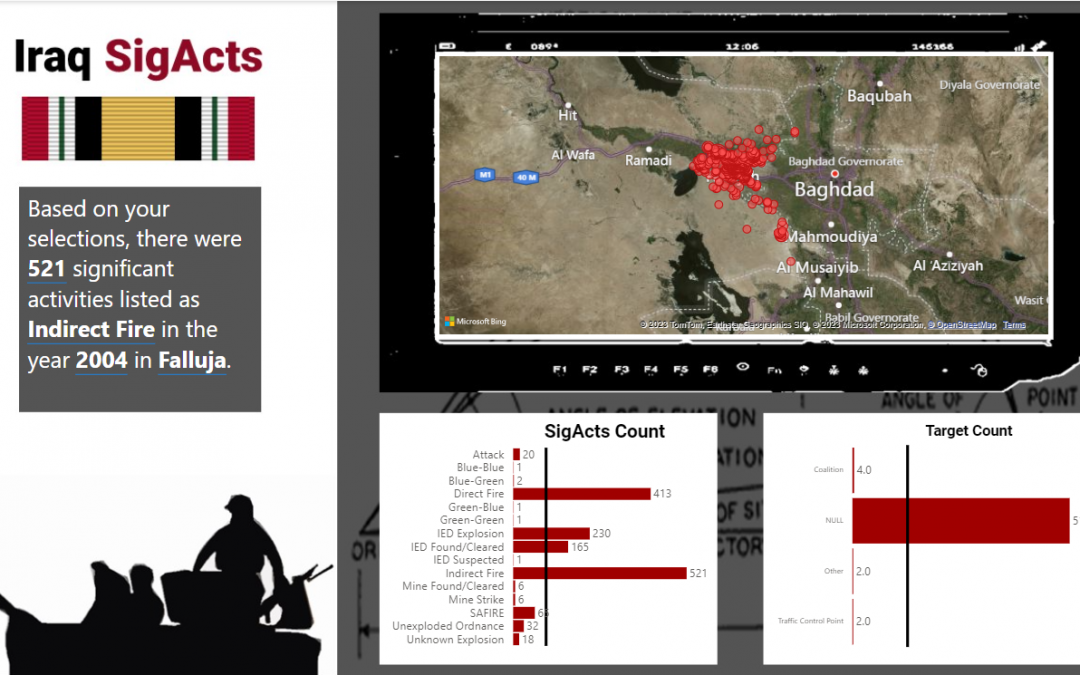
The other day I was catching up with Professor Andrew Shaver, who was the researcher I contacted and also the person that gave us Iraq and Afghanistan SigActs data. After the call we had, I went on the Political Violence Lab, which he founded, and saw that the same Iraq data was available. Enter Power BI!
Below is the report, which is a work-in-progress. I used things like Deneb to make the visuals (which is a great custom viz).
In truth, I don’t think I will ever truly be done looking at data like this. I am always fascinated by event data that tells the Veteran’s story.